Pro & Power Tools
Analytics and Market Pulse
Track your revenue, orders, and top products on the Analytics page, then use Market Pulse to research what is already selling on Etsy for any keyword or niche.
Printonic gives you two research tools side by side in the sidebar. Analytics looks inward: your revenue, your orders, and your best performing products. Market Pulse looks outward: it searches live Etsy results for a keyword and shows you the prices, tags, and listings that are winning right now.
Used together, they answer the two questions every seller keeps asking: how is my shop doing, and what should I sell next? This guide walks through both pages from top to bottom.
- 1
Dashboard > Analytics
Open Analytics
Click Analytics in the left sidebar. The page header reads "Track your sales performance, revenue trends, and top products." While your numbers load you will see a spinner, then the stat cards and charts appear.
Analytics is available to every seller. You do not need a Pro plan to use it.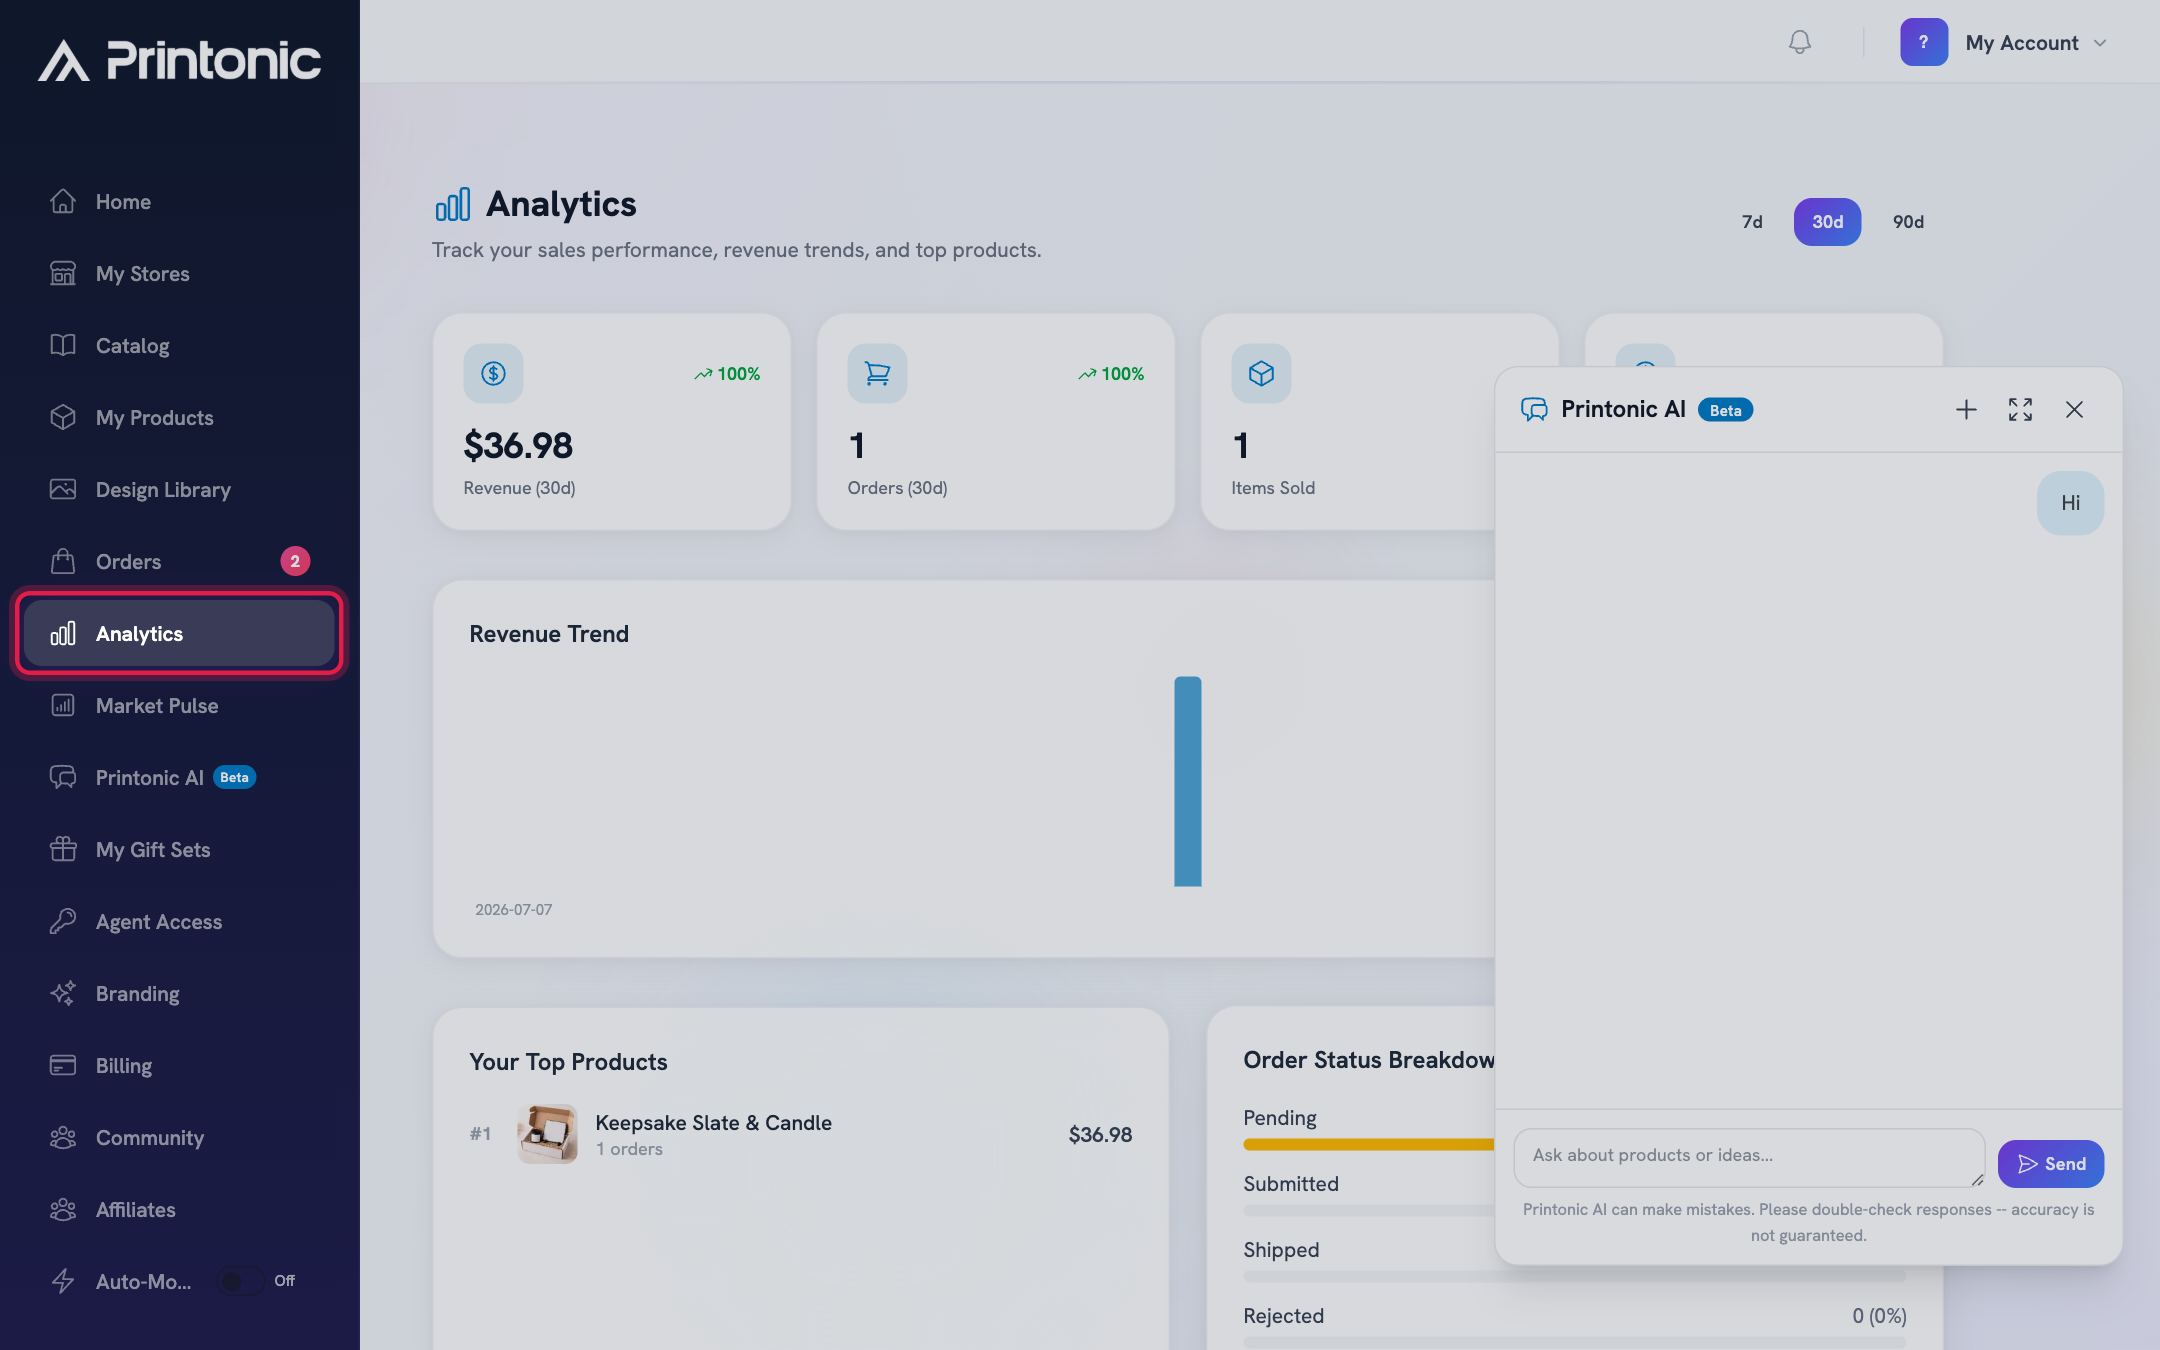
- 2
Dashboard > Analytics
Pick a time range
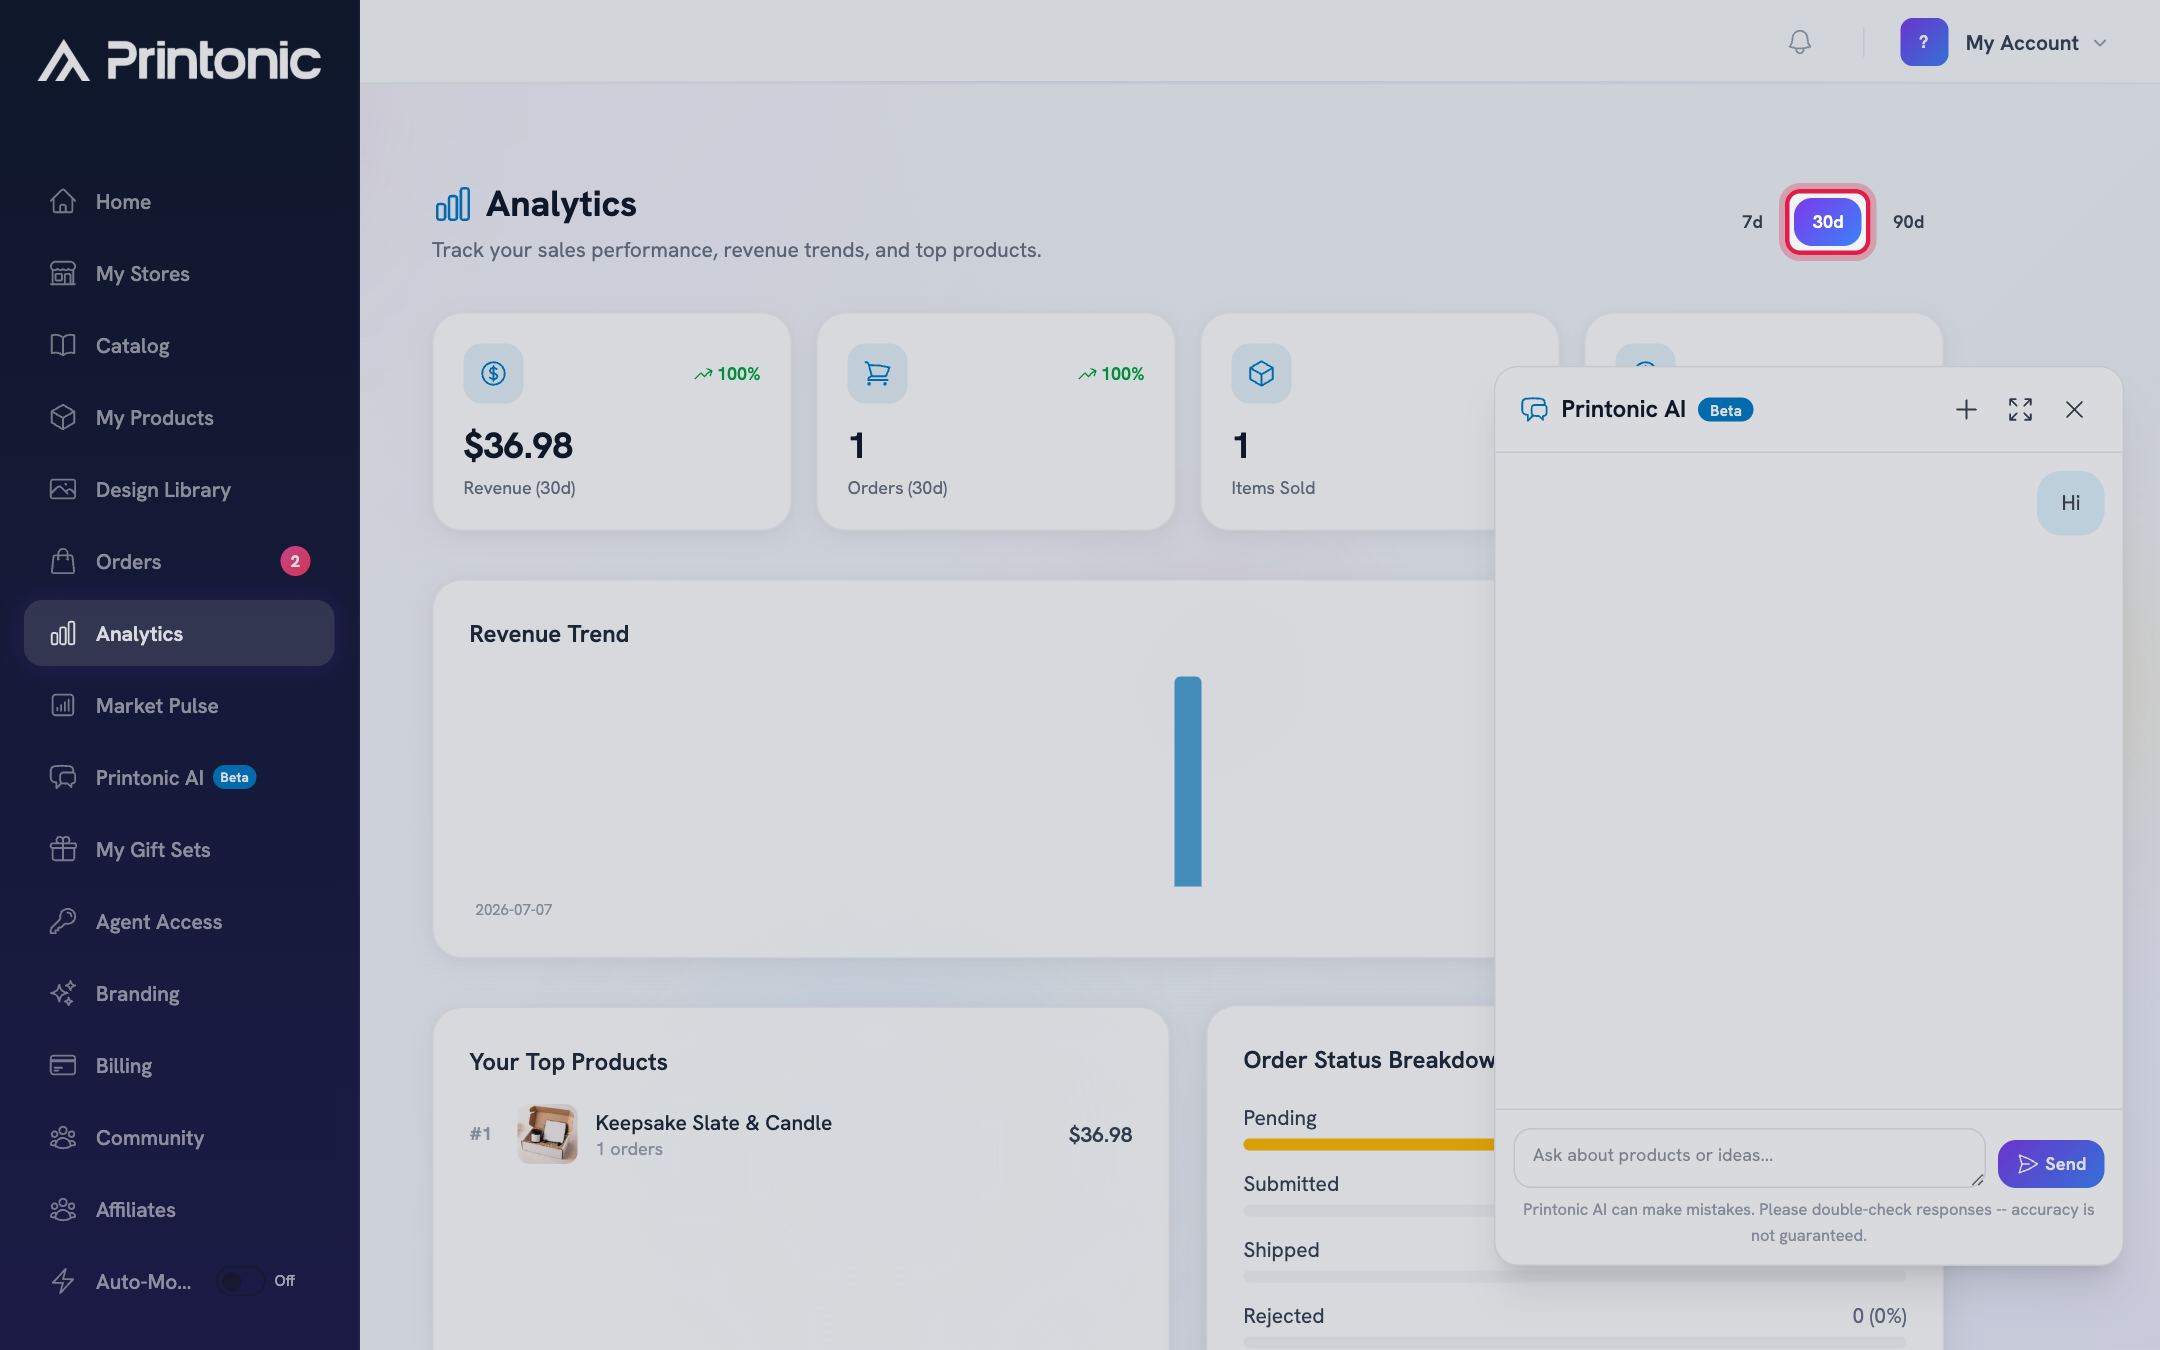
Use the 7d, 30d, and 90d buttons in the top right corner to set the period you want to look at. The page defaults to 30d. Everything above the Platform Bestsellers section (stat cards, Revenue Trend, Your Top Products, Order Status Breakdown) updates to match the range you pick.
- 3
Dashboard > Analytics
Read the four stat cards
The top row shows Revenue, Orders, Items Sold, and Avg Order Value for your selected range. Revenue and Orders also show a percentage with a green up arrow or a red down arrow. That percentage compares this period to the previous period of the same length, so "Revenue (30d)" with a green 12% means you earned 12% more than in the 30 days before that.
The percentage badge only appears when there is a change to report. If it is missing, your numbers were flat or there was no earlier period to compare against.
- 4
Dashboard > Analytics
Check the Revenue Trend chart
The Revenue Trend card shows a bar for each day in your range. Hover over any bar to see the exact date and revenue for that day. The first and last dates of the range are labeled under the chart.
If you have no sales in the period, the chart shows "No data yet". Switch to a longer range like 90d to see further back.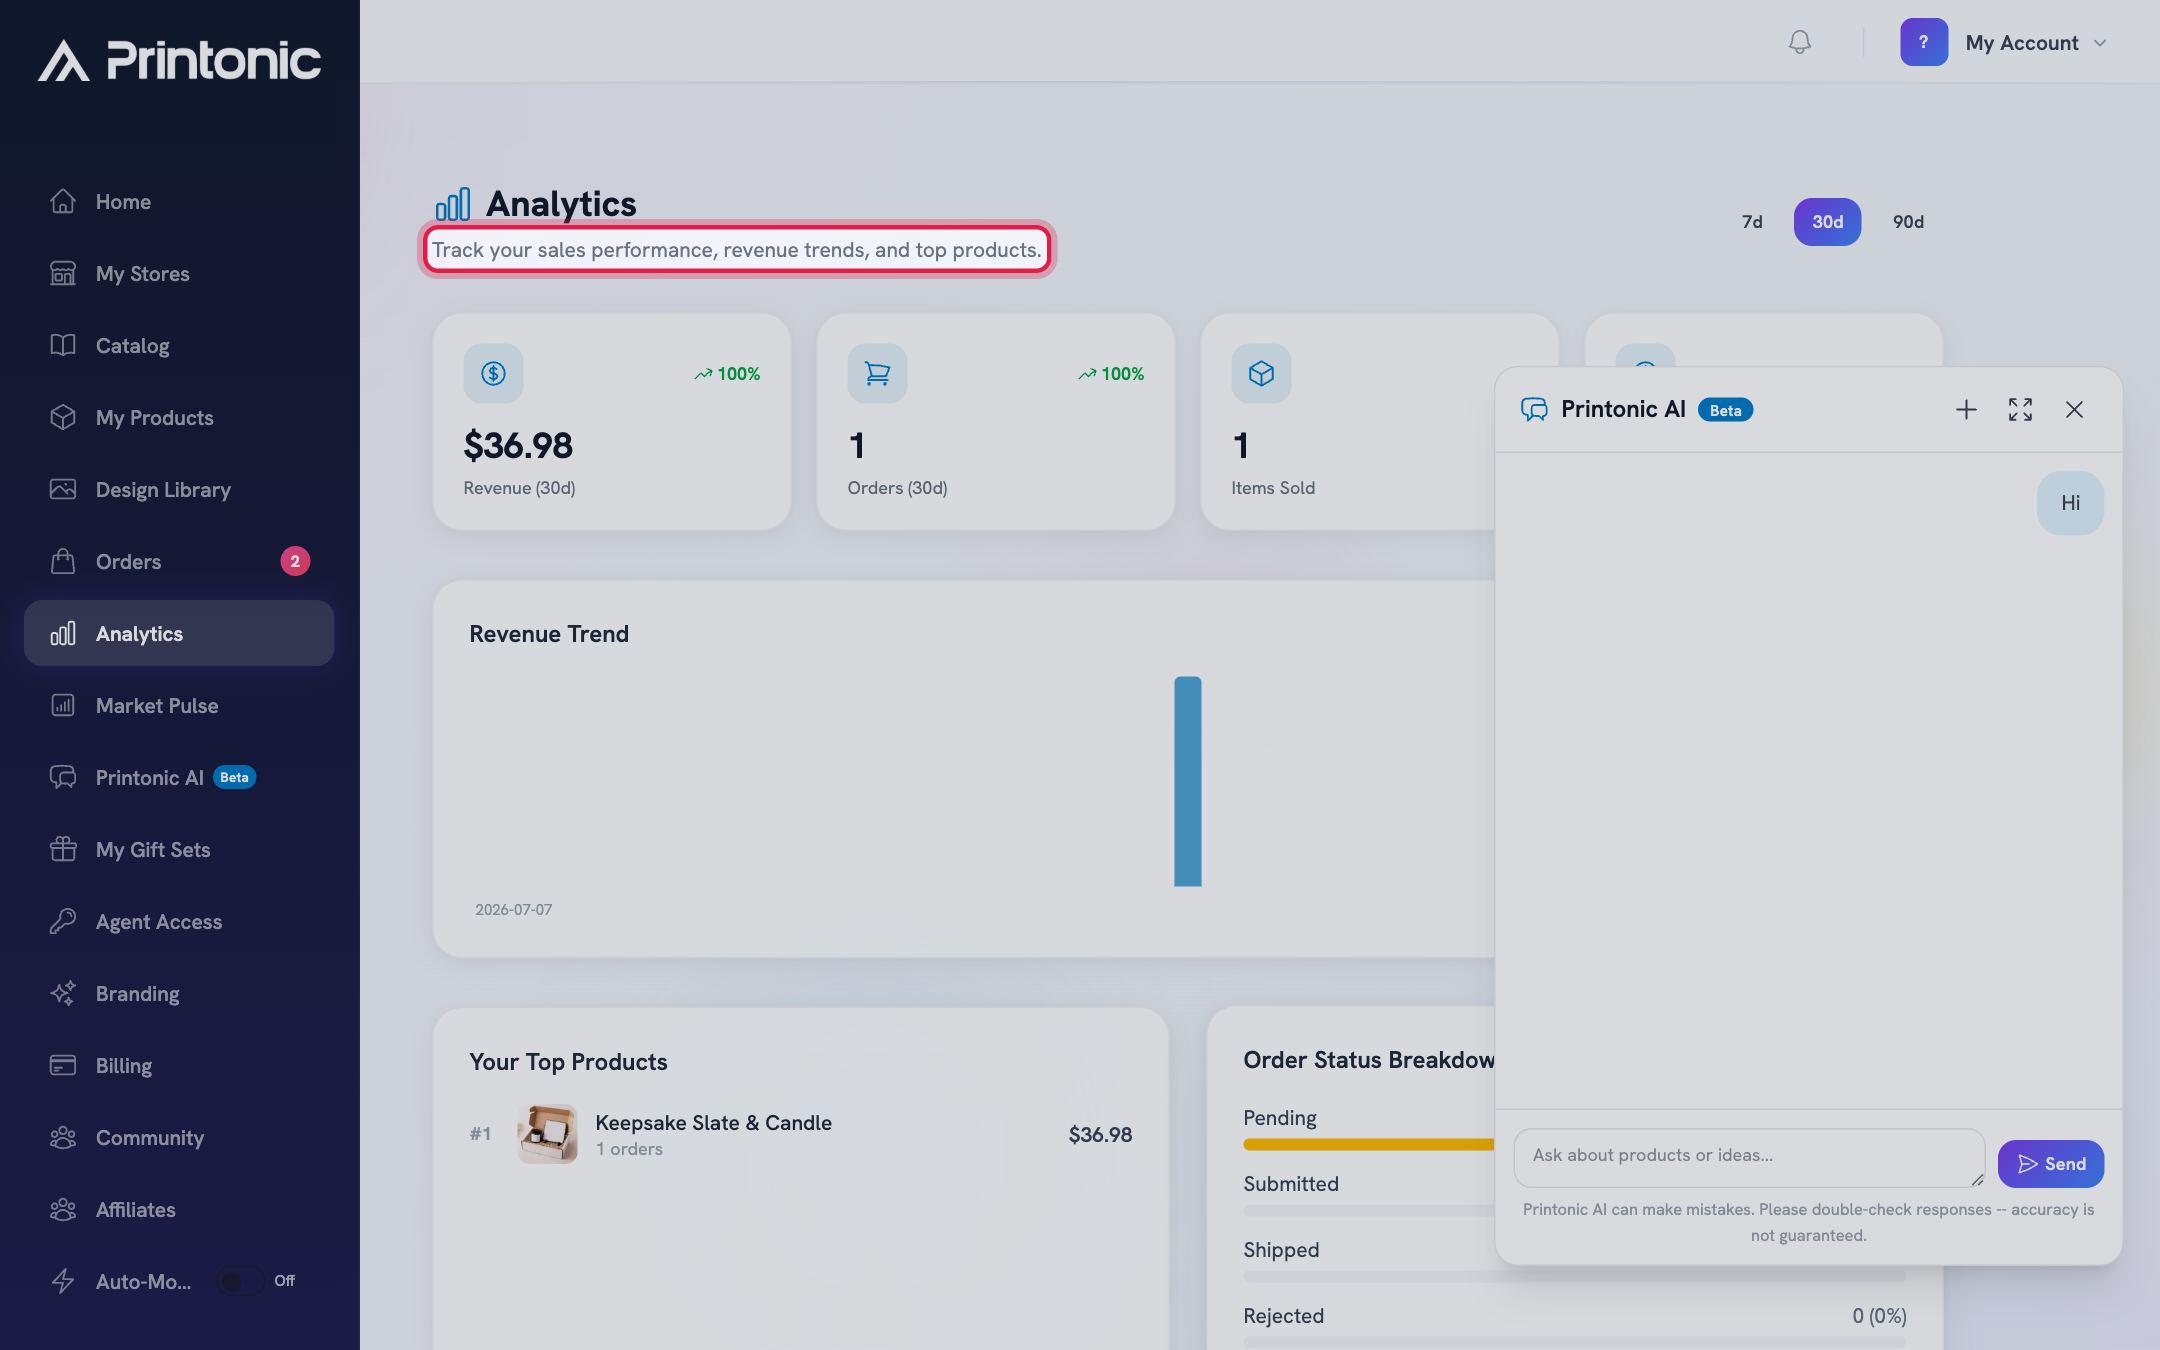
- 5
Dashboard > Analytics
Review Your Top Products, order statuses, and Platform Bestsellers
Below the chart, Your Top Products ranks your best sellers for the period with order counts and revenue for each. Next to it, Order Status Breakdown shows how your orders split across Pending, Submitted, Shipped, Rejected, Ignored, and Canceled, with a count and percentage bar for each status. At the bottom, Platform Bestsellers shows the top ranked products across all of Printonic, which is a quick way to spot product types worth adding to your own shop.
Platform Bestsellers reflects the whole platform, not just your sales, and it does not change when you switch time ranges.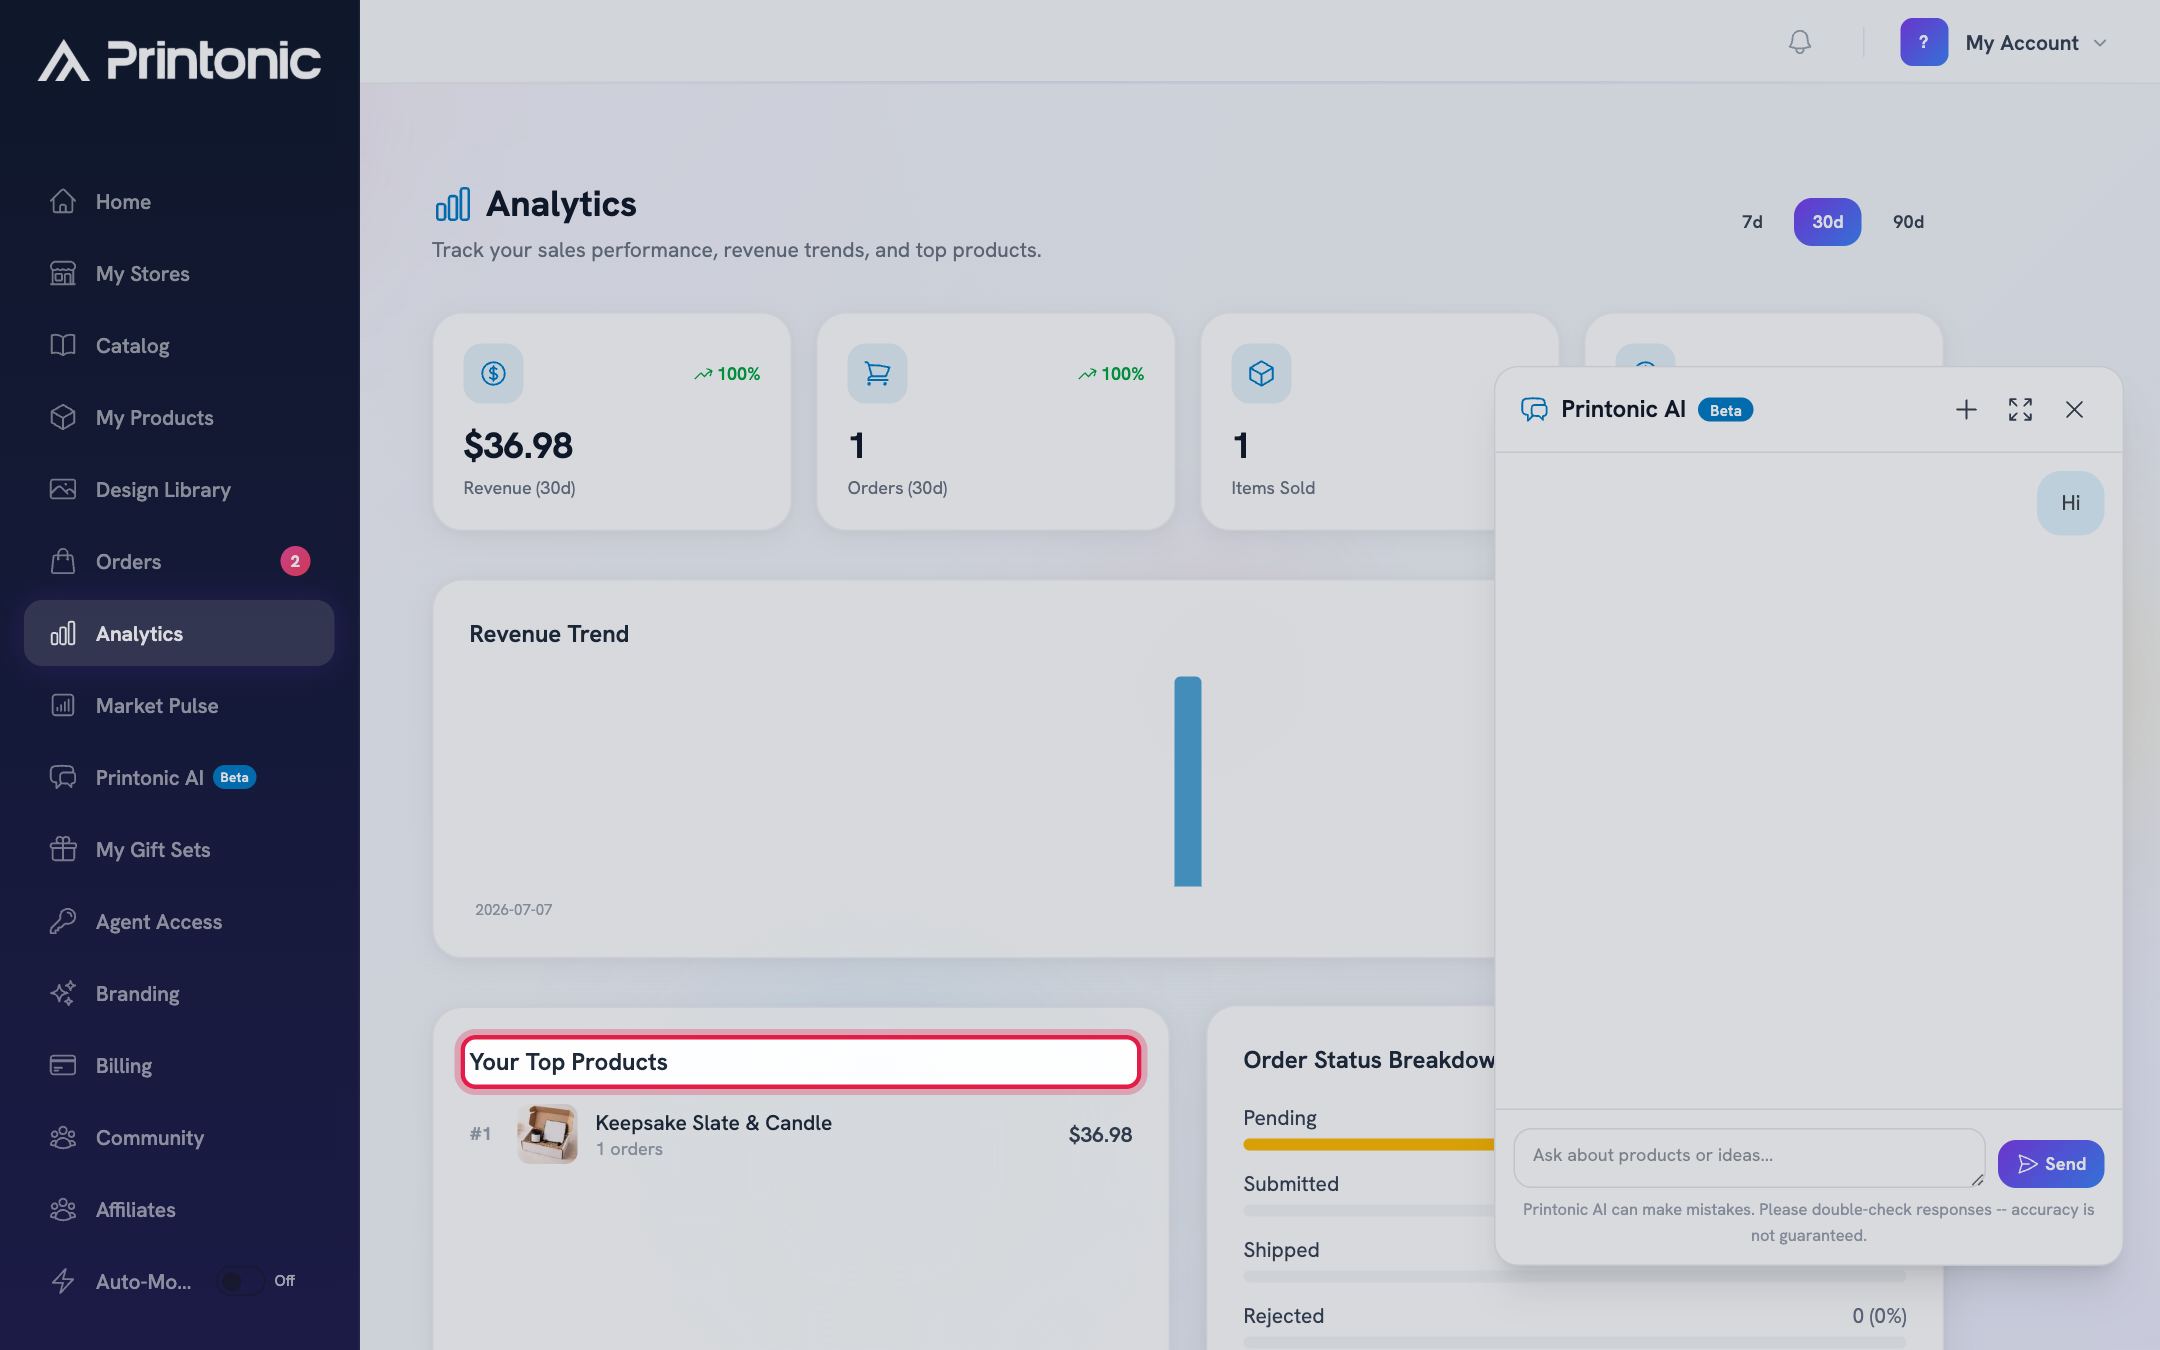
- 6
Dashboard > Market Pulse
Open Market Pulse and run a search
Click Market Pulse in the left sidebar. In the panel on the left, type a niche or keyword (the box says "Niche or keyword") and click Search. You can also click one of the Suggested chips like "gift set" or "custom mug", or use the From catalog dropdown to pick one of your catalog products and see similar items on Etsy. After a search, the panel shows "Current:" with your active keyword.
Market Pulse is in beta (you will see a Beta banner at the top), so expect the page to keep gaining data and features. If a search fails, an error banner appears; just try again or use a different keyword.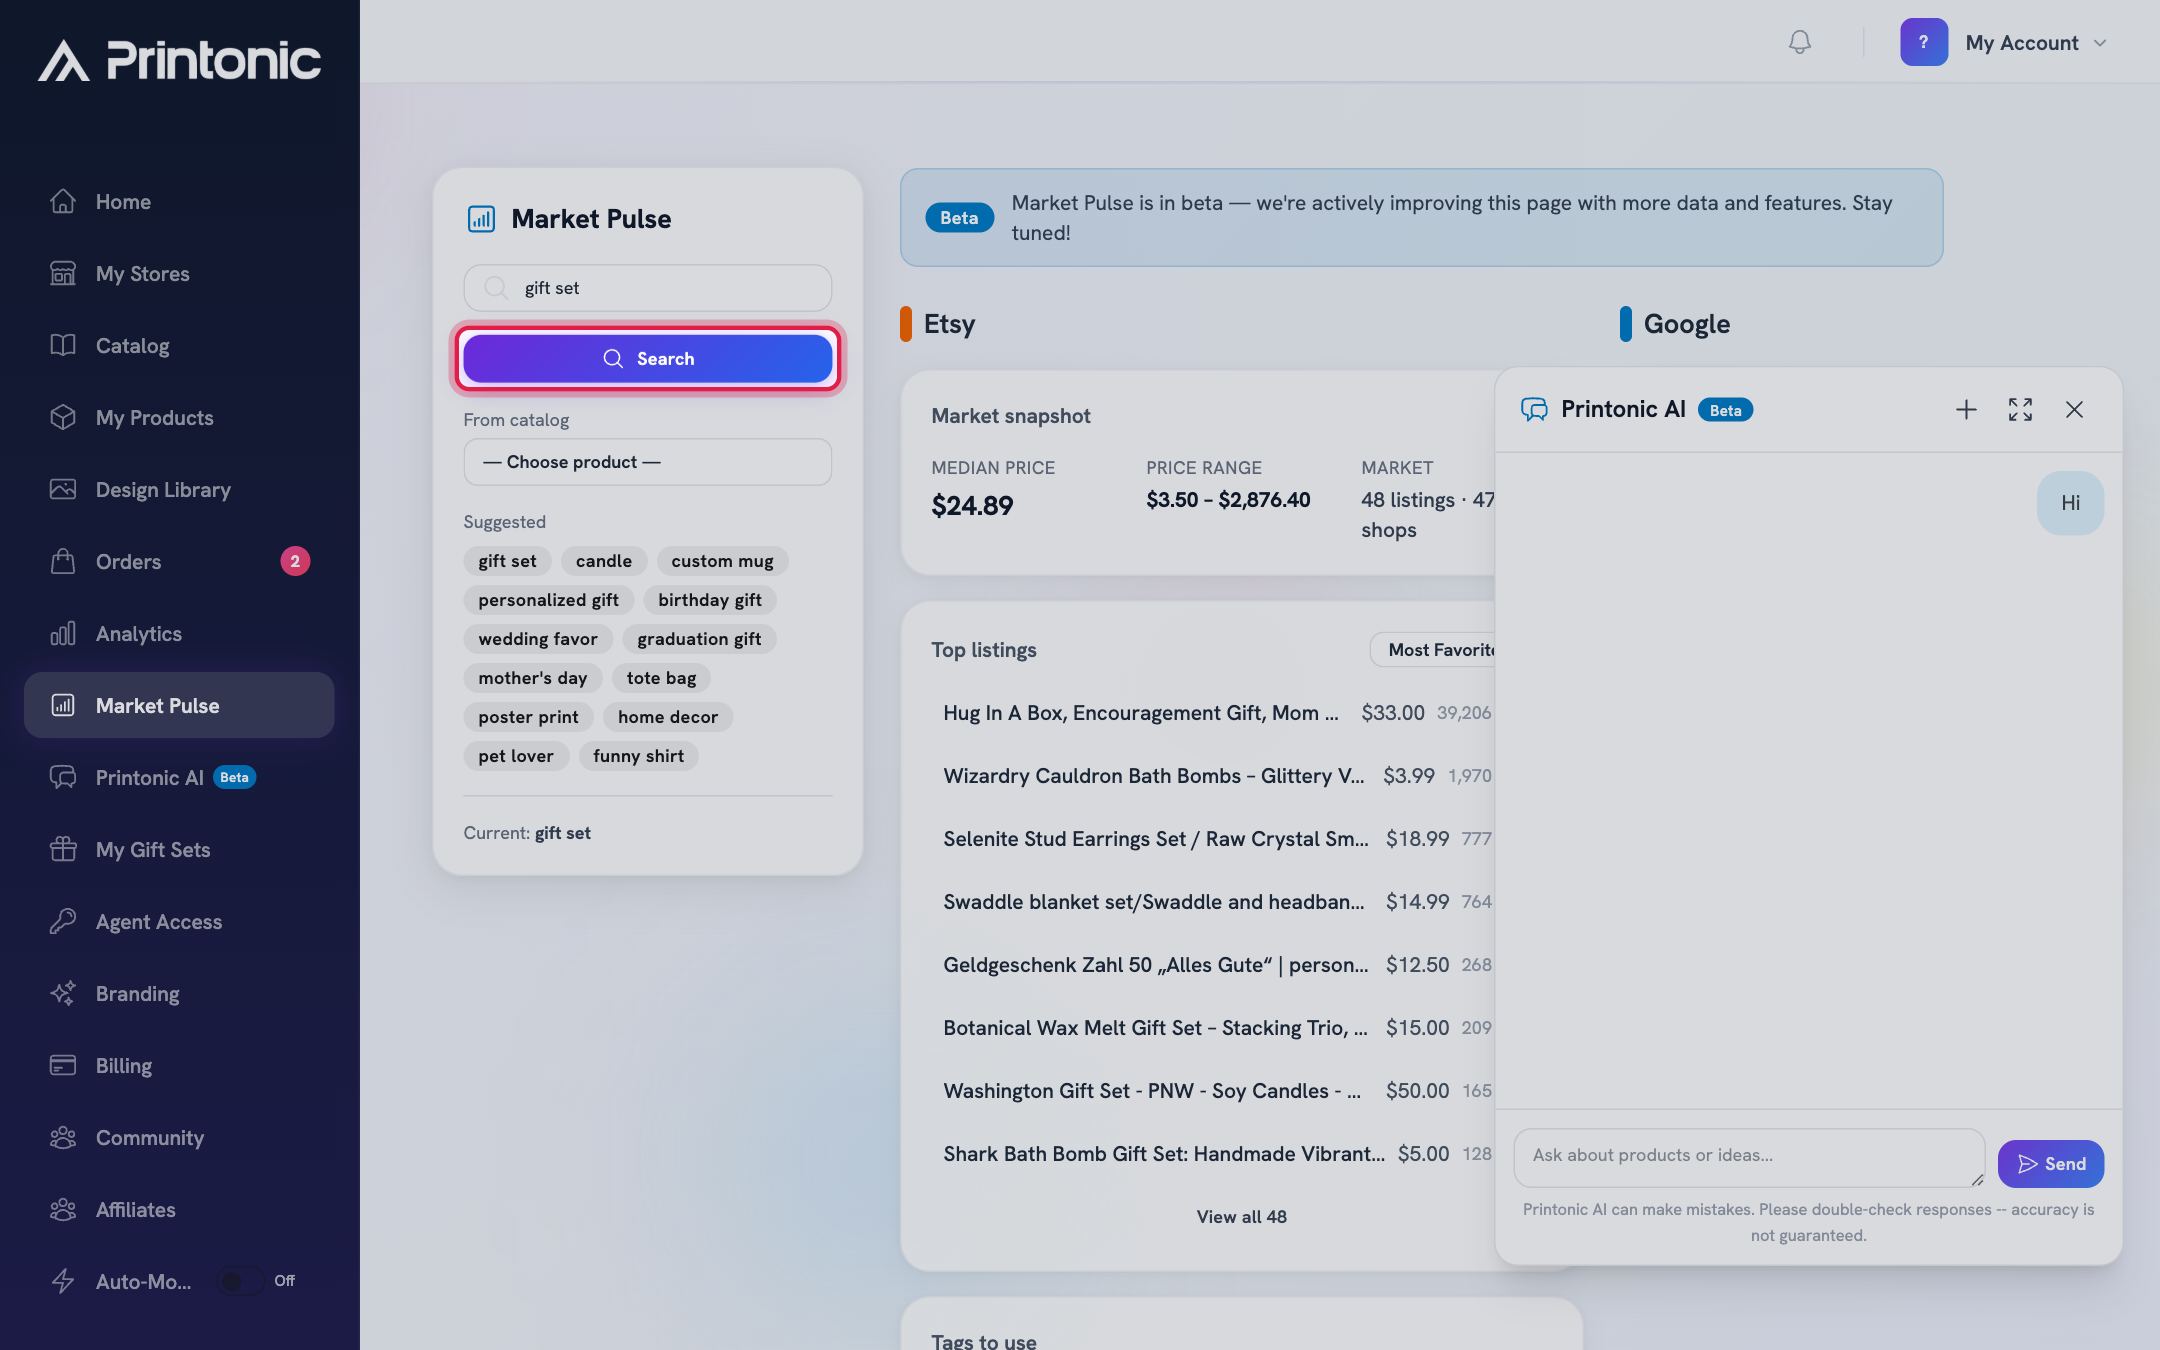
- 7
Dashboard > Market Pulse
Read the Etsy market snapshot and browse Top listings
The Etsy section opens with a Market snapshot: the median price, the full price range, and how many listings and unique shops the search found. Below it, Top listings shows the strongest results with each listing's title, price, and favorites count. Use the sort dropdown to switch between Relevance, Most Favorites, and Most Views. The list starts with 8 listings; click "View all" to expand to everything the search pulled in. Click any listing to open it on Etsy in a new tab and study the photos, description, and reviews.
Favorites are a good proxy for demand. A listing with thousands of favorites in your niche is worth a close look.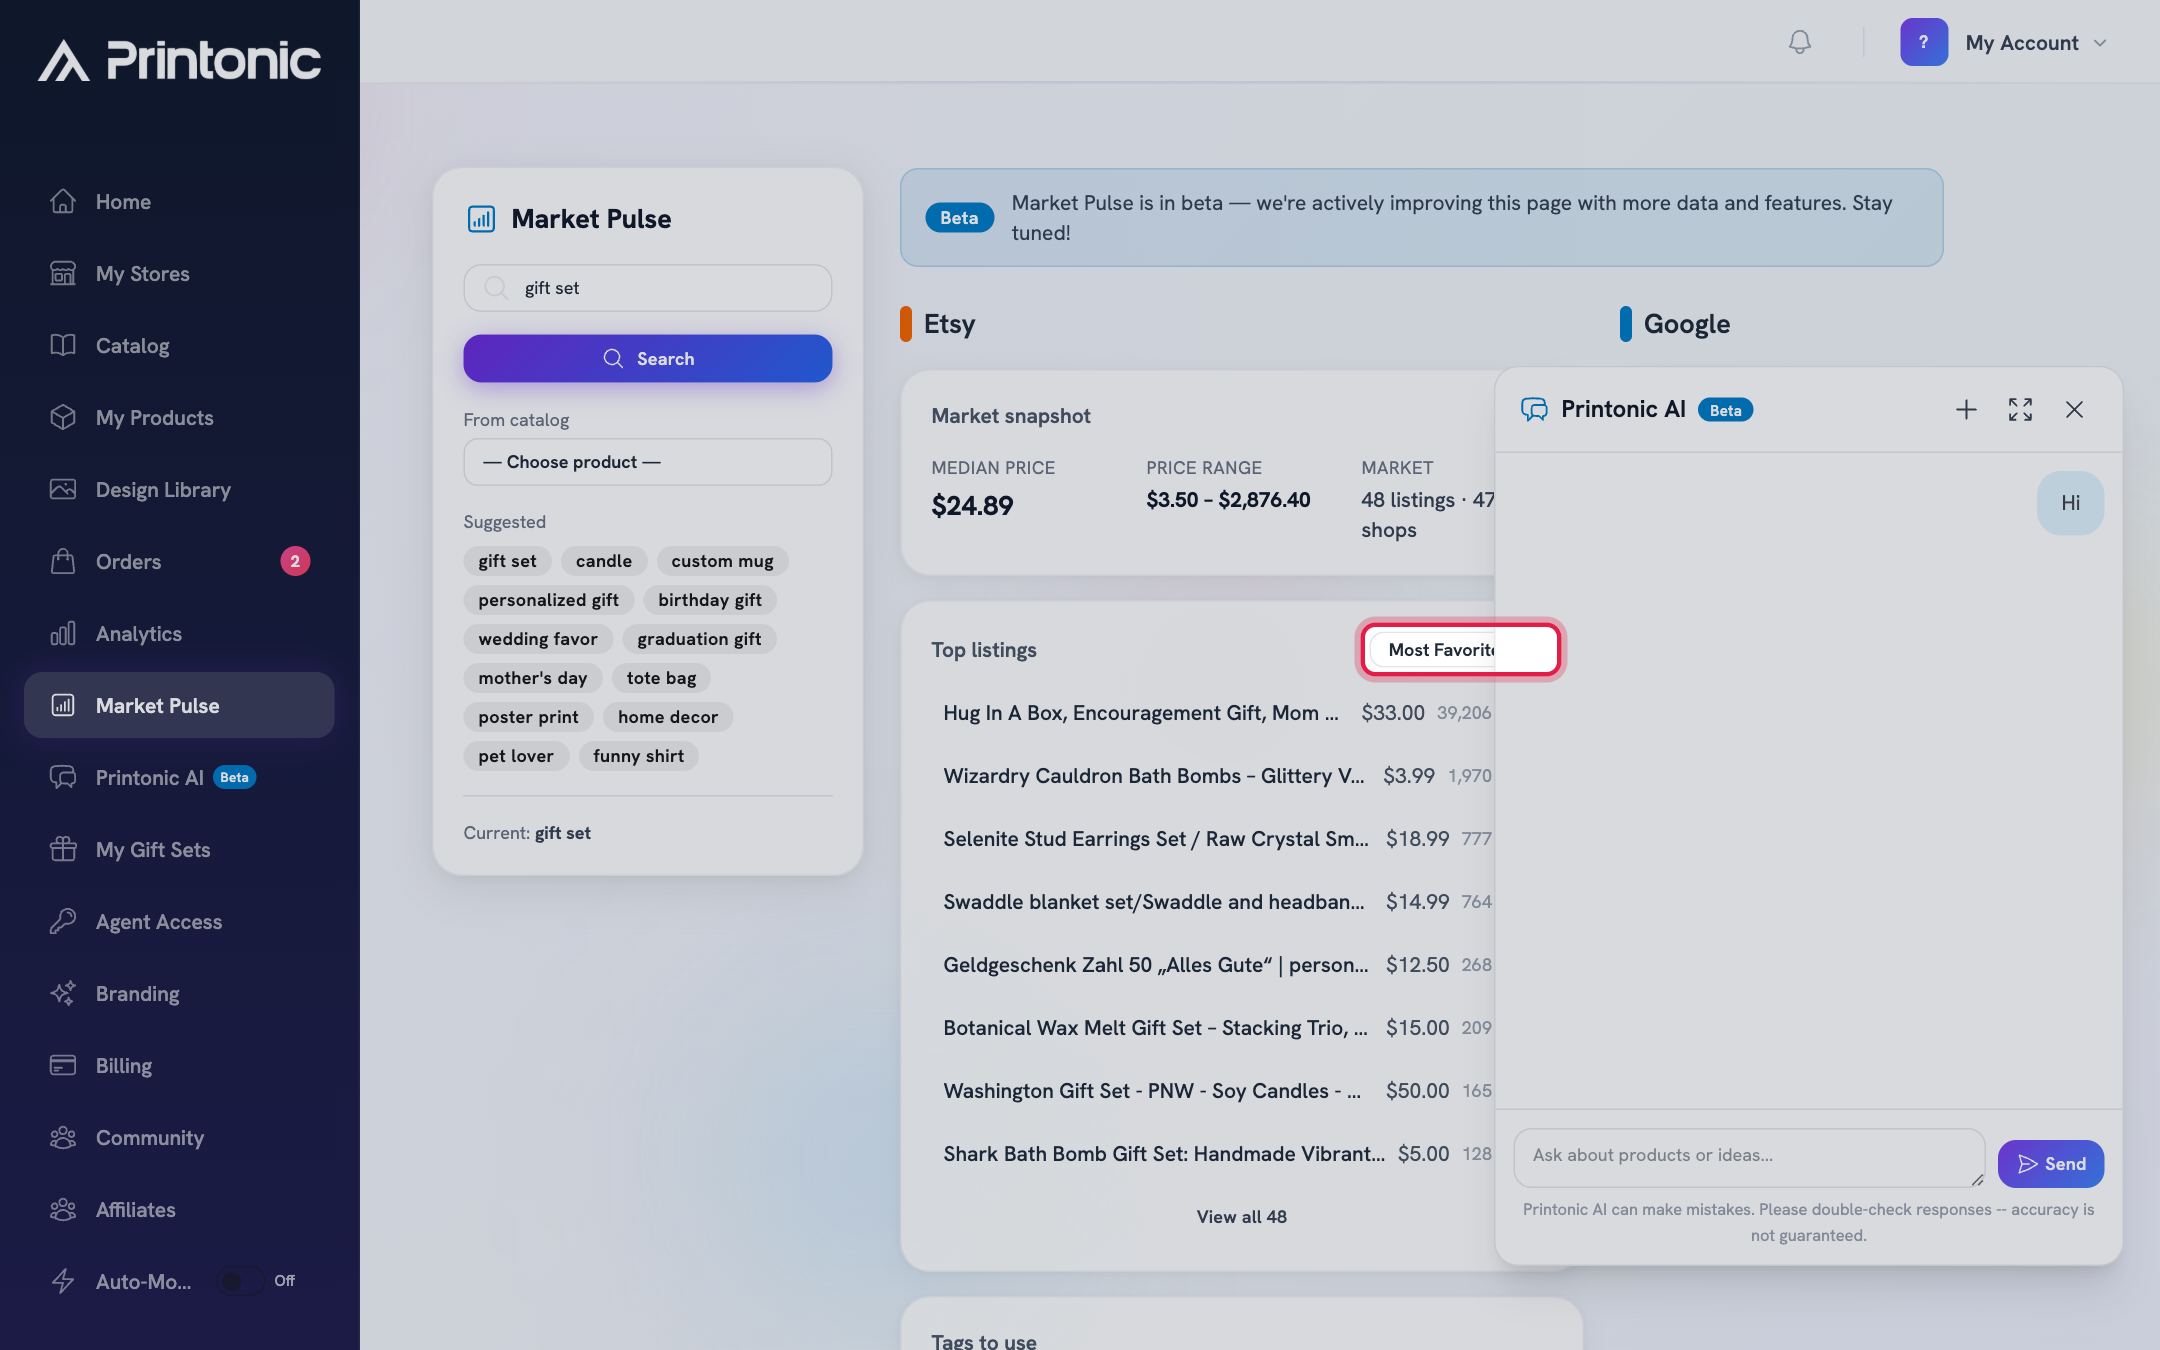
- 8
Dashboard > Market Pulse
Mine the tags and check pricing guidance
The Tags to use card lists the most common tags across the listings found, with a count next to each. On any tag, click Etsy to open that tag's search on Etsy in a new tab, or click Search to rerun Market Pulse on that tag. Click Copy tags to copy the top tags to your clipboard, ready to paste into a listing. On the right, the Google module's How to monetize card suggests a price range to compete in based on the market data, and the Google Trends (Shopping) button opens a 12 month trend chart for your keyword.
If the card says "No price data for this search. Try another keyword.", the results did not include usable prices. Broader keywords usually fix this.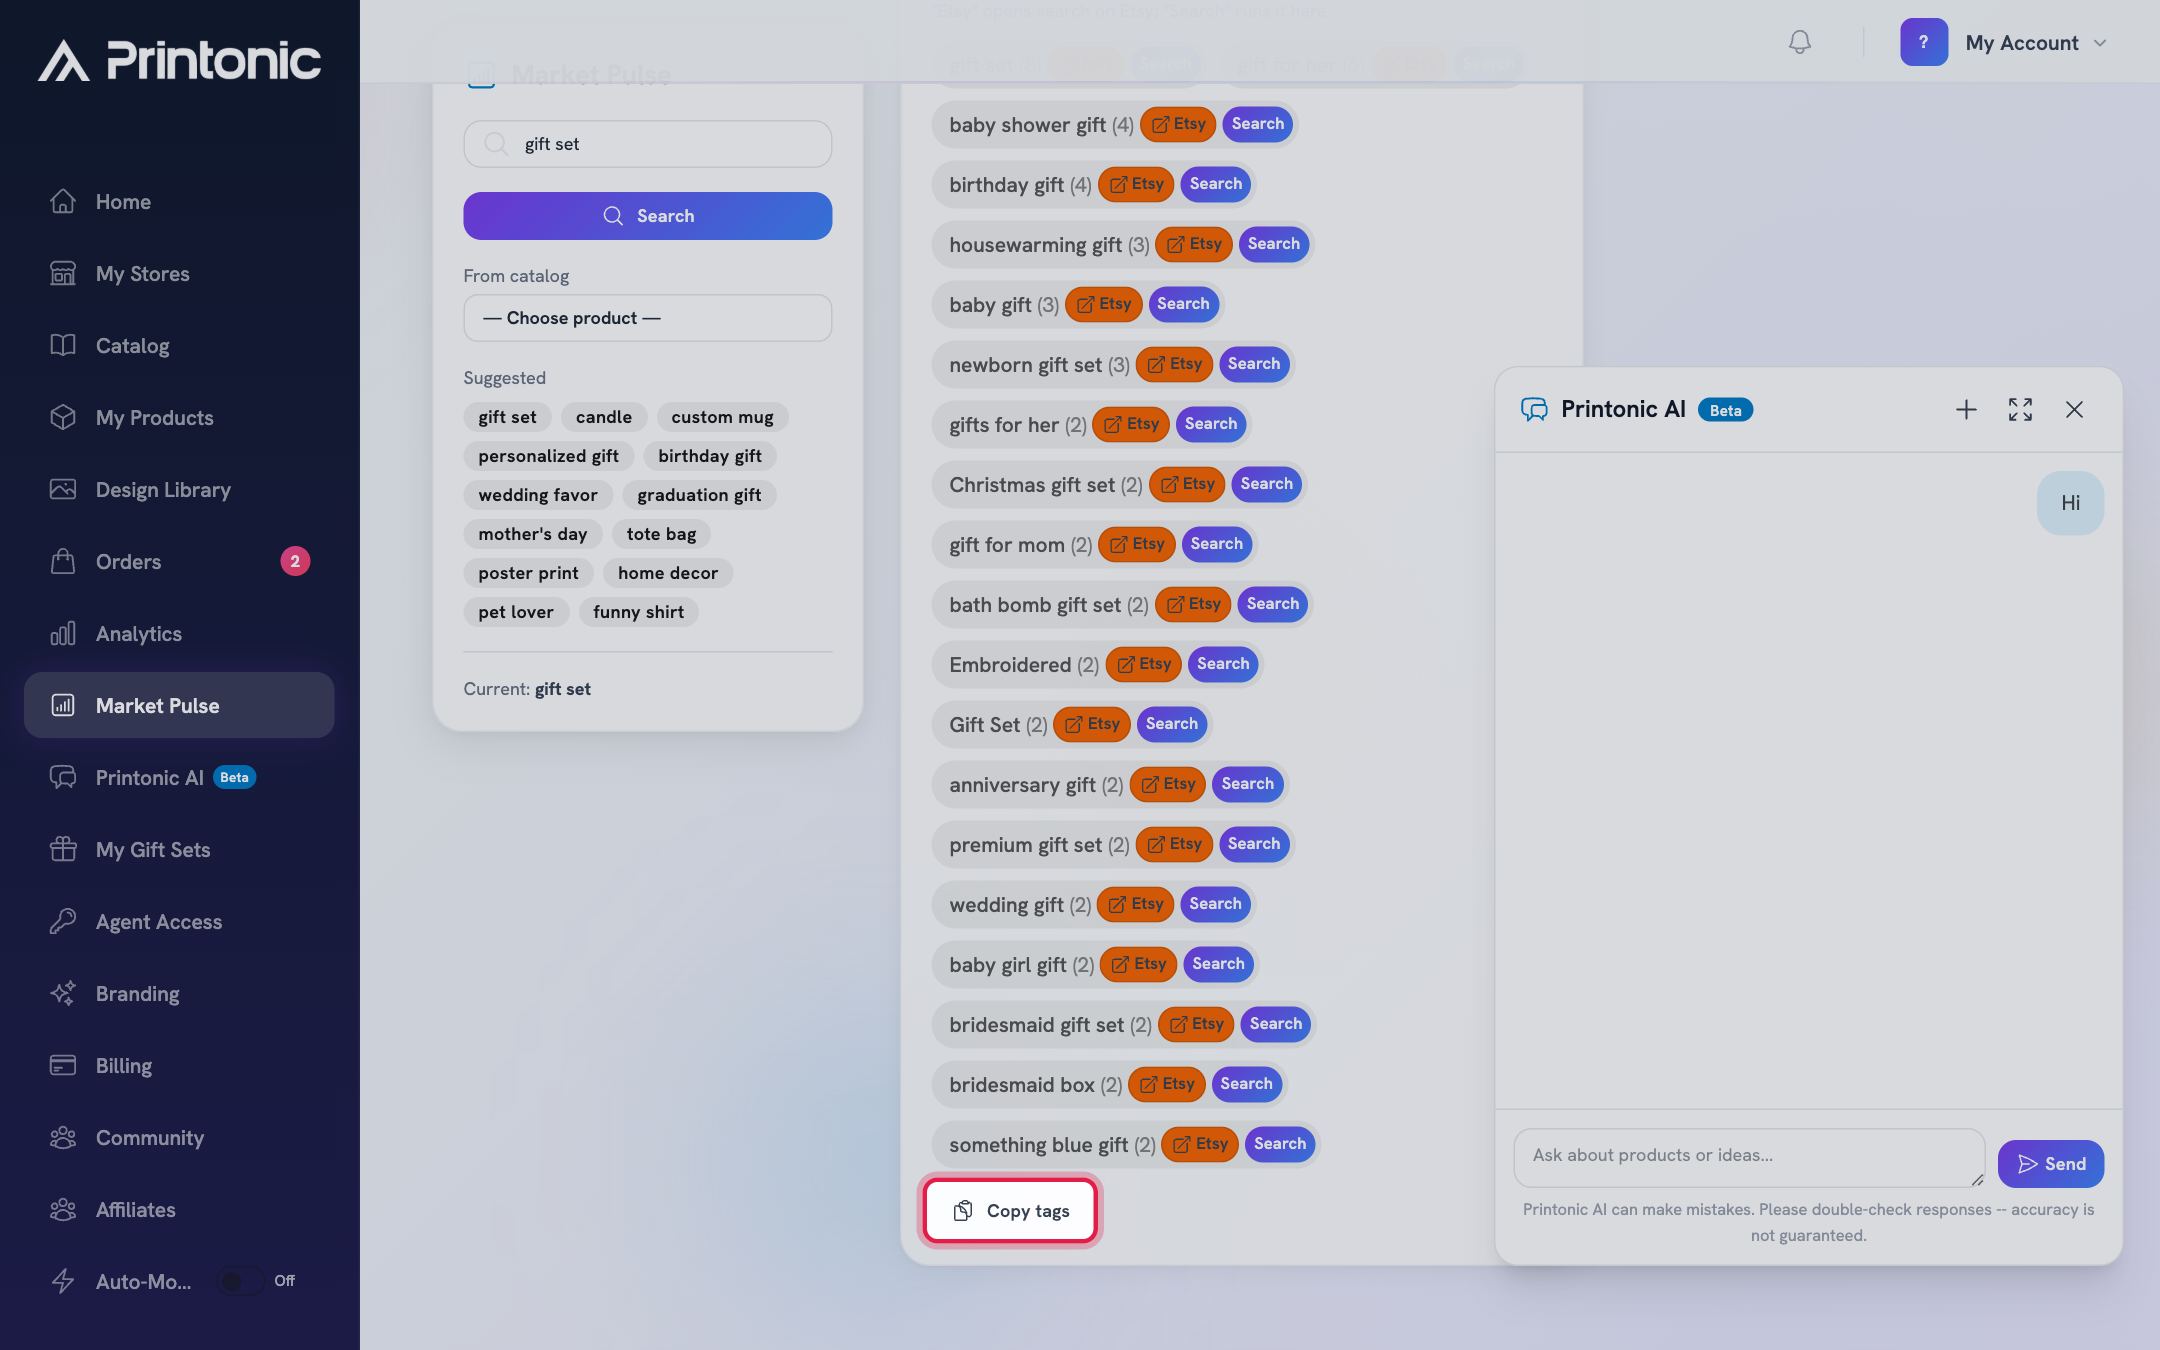
Good to know
- Hover any bar in the Revenue Trend chart to see the exact revenue for that day. It is the fastest way to spot which day a spike happened.
- In Market Pulse, sort Top listings by Most Views to find listings getting heavy traffic that have not piled up favorites yet. Those can signal rising niches.
- Tags with the highest counts in Tags to use are the phrases buyers actually search. Copy them and work the best ones into your own listing titles and tags.
- Check Platform Bestsellers on the Analytics page before picking your next product. If a product type is topping the platform, there is proven demand for it.
Common questions
Do I need a Pro plan for Analytics or Market Pulse?
No. Both pages are included for every seller. They live in the sidebar without a lock icon, unlike Pro features such as Printonic AI and My Gift Sets.
Where does Market Pulse data come from?
Each search queries live Etsy listings for your keyword and summarizes what comes back: prices, tags, favorites, views, and shop counts. You do not need to have an Etsy store connected to use it.
Why is my Analytics page mostly empty?
The stat cards, chart, and Your Top Products only reflect orders in your selected range. If you are new or had a quiet stretch, try the 90d range. Platform Bestsellers still shows platform data even before you have sales of your own.
What price should I pick from the Market Pulse numbers?
The How to monetize card shows the competitive range and the median for your keyword. Pricing at or just below the median is a solid starting point; you can always adjust once you see how your listing performs.
Related guides
Your dashboard at a glance
A quick tour of the dashboard Home page: stat cards, alerts, quick actions, recent orders, store health, and the Getting Started checklist for new sellers.
Publish a listing to your store
Finish your product's Listing step (store, title, description, pricing), publish it to your connected store, and find your SKU codes afterward.